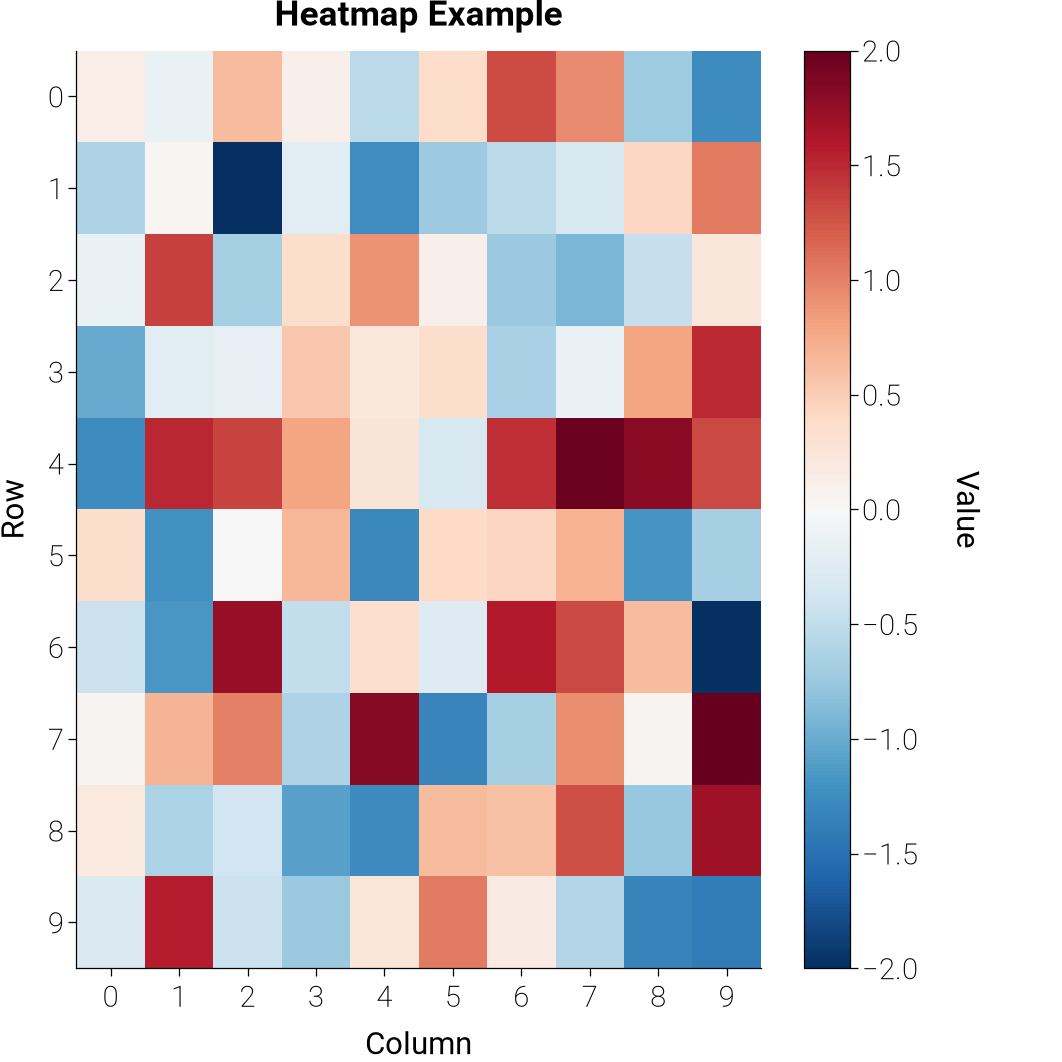
Heatmap with colorbar
- Chart type
- heatmap
- Preset
- scientific
- Tags
- heatmap, colorbar, diverging
- dartwork-mpl
- 0.7.1 · 2026-11-15
Source
"""Heatmap with colorbar.

A 10x10 synthetic matrix rendered with a diverging colormap. Demonstrates:

- ``dm.style.use("scientific")``
- ``imshow`` with an explicit ``vmin`` / ``vmax`` pair to pin the colormap
  range
- ``plt.colorbar`` alongside the axes with a rotated label

Run with:
    python source.py
"""

from pathlib import Path

import matplotlib.pyplot as plt
import numpy as np

import dartwork_mpl as dm

OUTPUT_DIR = Path(__file__).parent
OUTPUT_DIR.mkdir(parents=True, exist_ok=True)

dm.style.use("scientific")

fig, ax = plt.subplots(figsize=dm.figsize("9cm", "square"))

rng = np.random.default_rng(0)
data = rng.standard_normal((10, 10))

im = ax.imshow(data, cmap="RdBu_r", aspect="auto", vmin=-2, vmax=2)
cbar = plt.colorbar(im, ax=ax)
cbar.set_label("Value", rotation=270, labelpad=15)

ax.set_xlabel("Column")
ax.set_ylabel("Row")
ax.set_title("Heatmap Example")
ax.set_xticks(np.arange(10))
ax.set_yticks(np.arange(10))

dm.simple_layout(fig)
dm.save_formats(fig, OUTPUT_DIR / "heatmap", formats=("png",), dpi=300)
plt.close(fig)
print(f"Saved: {OUTPUT_DIR / 'heatmap.png'}")
source.py · Back to gallery