Scatter plot with linear fit
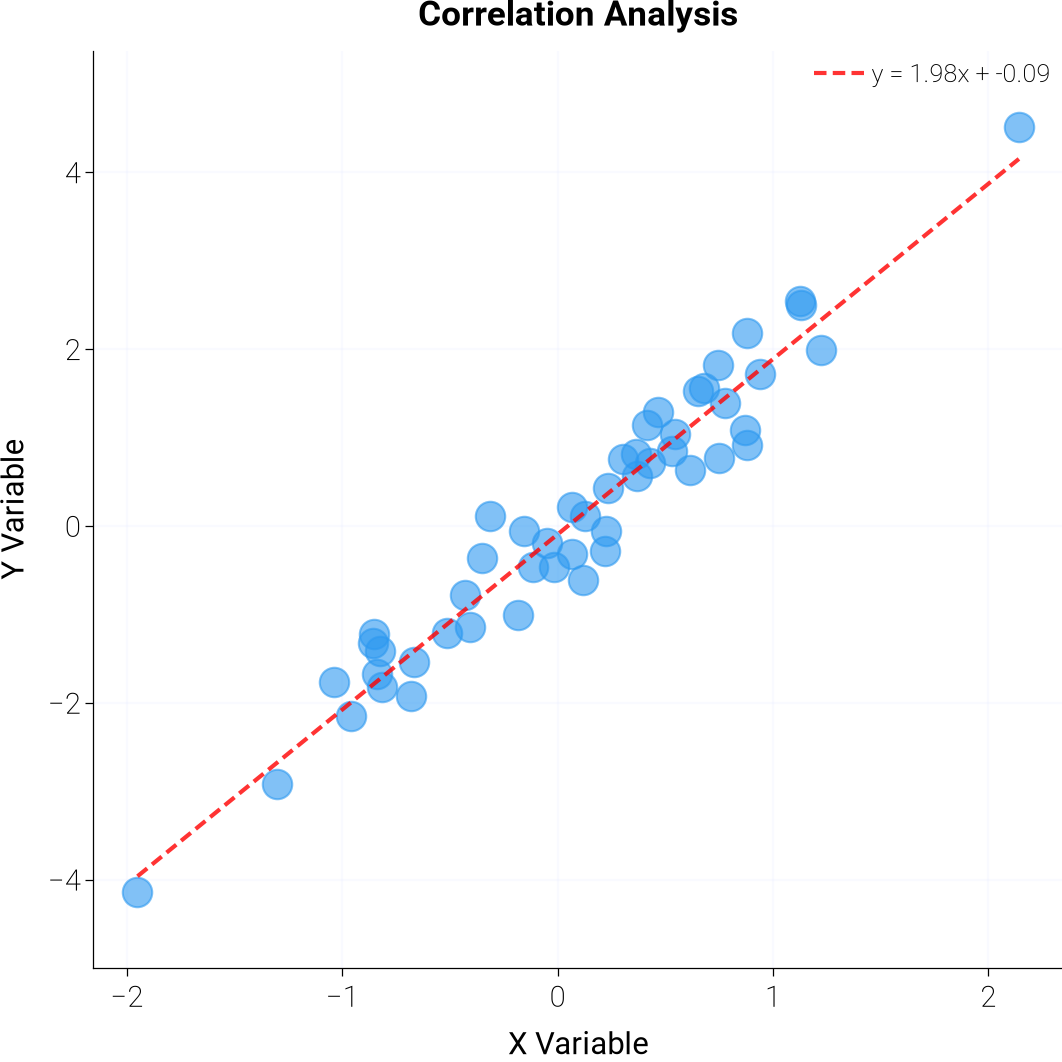
- Chart type
- scatter
- Preset
- scientific
- Tags
- scatter, regression, correlation
- dartwork-mpl
- 0.7.1 · 2026-11-15
Source
"""Scatter plot with a linear regression overlay.

Synthetic correlated data fit with ``numpy.polyfit``. Demonstrates:

- ``dm.style.use("scientific")`` for a compact science preset
- a subtle low-alpha background grid via ``ax.grid``
- Legend with the fitted equation

Run with:
    python source.py
"""

from pathlib import Path

import matplotlib.pyplot as plt
import numpy as np

import dartwork_mpl as dm

OUTPUT_DIR = Path(__file__).parent
OUTPUT_DIR.mkdir(parents=True, exist_ok=True)

dm.style.use("scientific")

fig, ax = plt.subplots(figsize=dm.figsize("9cm", "square"))

rng = np.random.default_rng(42)
x = rng.standard_normal(50)
y = 2 * x + rng.standard_normal(50) * 0.5

ax.scatter(x, y, alpha=0.6, s=50)

z = np.polyfit(x, y, 1)
p = np.poly1d(z)
x_line = np.linspace(x.min(), x.max(), 100)
ax.plot(
    x_line, p(x_line), "r--", alpha=0.8, label=f"y = {z[0]:.2f}x + {z[1]:.2f}"
)

ax.grid(True, color="dc.indigo1", alpha=0.15, linewidth=0.5)
ax.set_axisbelow(True)
ax.set_xlabel("X Variable")
ax.set_ylabel("Y Variable")
ax.set_title("Correlation Analysis")
ax.legend()

dm.simple_layout(fig)
dm.save_formats(fig, OUTPUT_DIR / "scatter_with_fit", formats=("png",), dpi=300)
plt.close(fig)
print(f"Saved: {OUTPUT_DIR / 'scatter_with_fit.png'}")
source.py · Back to gallery